SMLDS_LAB
Prg 3: A dataset contains information about car models, including the engine size (in Liters), fuel efficiency (miles per gallon), and car price. Use a pair plot or correlation matrix to explore the relationships between these variables. Which variables seem to have the strongest relationships, and what might be the practical significance of these findings?
import pandas as pd
import seaborn as sns
import matplotlib.pyplot as plt
df = pd.read_csv("car_dataset.csv")
print("First 5 rows of dataset:")
print(df.head())
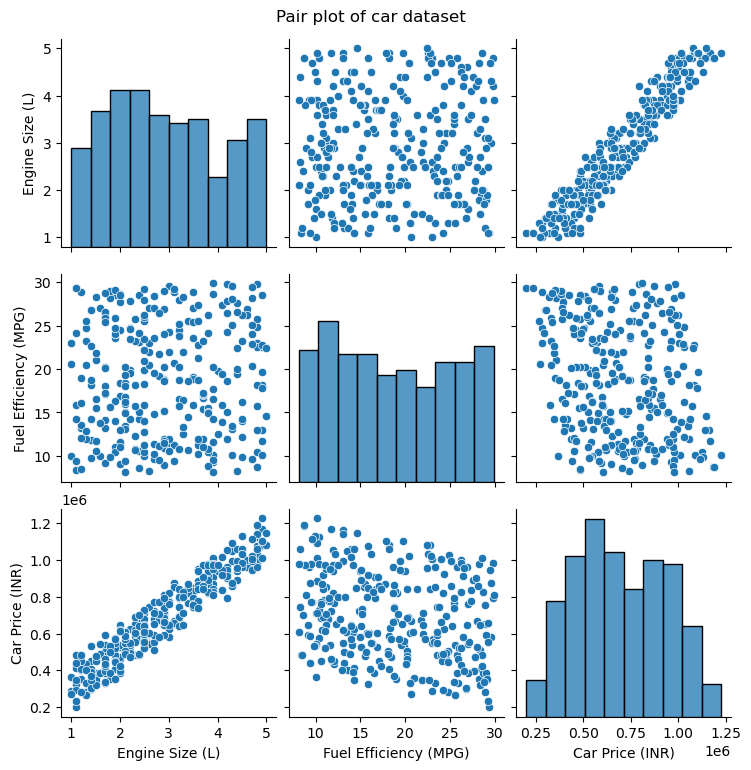
print("--Generating pair plot--")
sns.pairplot(df,diag_kind="hist")
plt.suptitle("Pair plot of car dataset",y=1.02)
plt.show()
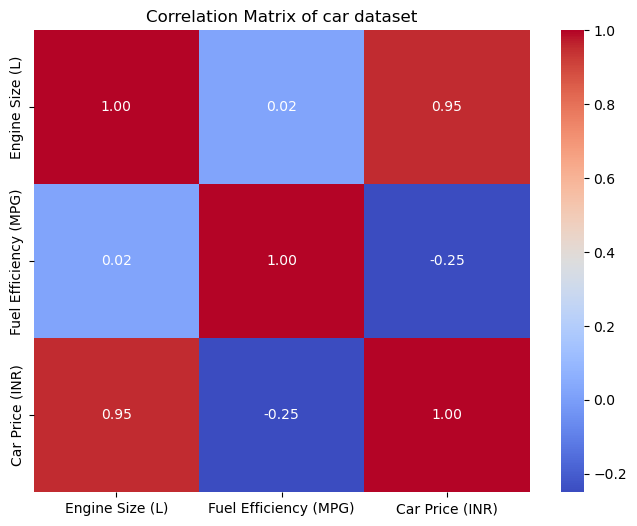
corr_matrix=df.corr(numeric_only=True)
plt.figure(figsize=(8,6))
sns.heatmap(corr_matrix,annot=True, cmap="coolwarm", fmt=".2f")
plt.title("Correlation Matrix of car dataset")
plt.show()
print("\n Correlation Matrix")
print(corr_matrix)
corr_matrix
First 5 rows of dataset:
     Company  Engine Size (L)  Fuel Efficiency (MPG)  Car Price (INR)
0  Chevrolet              4.5                   14.0          1058934
1        Kia              1.1                   29.4           200000
2    Renault              2.4                   10.6           682393
3    Hyundai              1.2                   13.2           437970
4  Chevrolet              4.9                   22.6          1076890
--Generating pair plot--
 Correlation Matrix
                       Engine Size (L)  Fuel Efficiency (MPG)  Car Price (INR)
Engine Size (L)               1.000000               0.022267         0.954807
Fuel Efficiency (MPG)         0.022267               1.000000        -0.249799
Car Price (INR)               0.954807              -0.249799         1.000000
| Engine Size (L) | Fuel Efficiency (MPG) | Car Price (INR) | |
|---|---|---|---|
| Engine Size (L) | 1.000000 | 0.022267 | 0.954807 |
| Fuel Efficiency (MPG) | 0.022267 | 1.000000 | -0.249799 |
| Car Price (INR) | 0.954807 | -0.249799 | 1.000000 |
Interpretation
Strongest Positive Correlation: Between Engine Size (L) and Car Price (INR) (0.955), indicating that larger engine sizes are strongly associated with higher car prices.
Strongest Negative Correlation: Between Fuel Efficiency (MPG) and Car Price (INR) (-0.250), showing a weak negative relationship where more fuel-efficient cars tend to be slightly less expensive.
Other Negative Correlation: There is no other meaningful negative correlation in the matrix; the correlation between Engine Size (L) and Fuel Efficiency (MPG) is very close to zero (0.022), indicating almost no linear relationship.
Practical Significance
Manufacturers face a trade-off: Larger engines → higher price but only a slight impact on fuel efficiency.
Consumers may prefer:
High MPG cars (cost-efficient, environmentally friendly, and generally less expensive).
Large engines (luxury/performance, but significantly more expensive).**
This analysis helps car buyers and automobile companies understand the balance between price, performance, and fuel efficiency.