import numpy as np
import matplotlib.pyplot as plt
from scipy import stats
n = 20
sample_mean = 8.0
sample_sd = 2.0
mu0 = 0.0
alpha = 0.05
df = n - 1
se = sample_sd / np.sqrt(n)
t_stat = (sample_mean - mu0) / se
p_value = 2 * stats.t.sf(abs(t_stat), df)
t_crit = stats.t.ppf(1 - alpha/2, df)
ci_lower = sample_mean - t_crit * se
ci_upper = sample_mean + t_crit * se
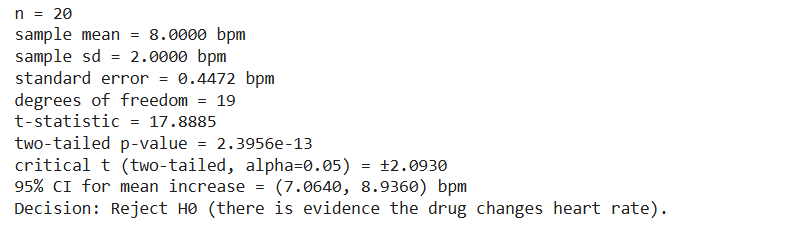
print(f"n = {n}")
print(f"sample mean = {sample_mean:.4f} bpm")
print(f"sample sd = {sample_sd:.4f} bpm")
print(f"standard error = {se:.4f} bpm")
print(f"degrees of freedom = {df}")
print(f"t-statistic = {t_stat:.4f}")
print(f"two-tailed p-value = {p_value:.4e}")
print(f"critical t (two-tailed, alpha={alpha}) = ±{t_crit:.4f}")
print(f"95% CI for mean increase = ({ci_lower:.4f}, {ci_upper:.4f}) bpm")
if p_value < alpha:
print("Decision: Reject H0 (there is evidence the drug changes heart rate).")
else:
print("Decision: Fail to reject H0 (no evidence the drug changes heart rate).")
x_min = -5
x_max = max(25, t_stat + 5)
x = np.linspace(x_min, x_max, 1000)
y = stats.t.pdf(x, df)
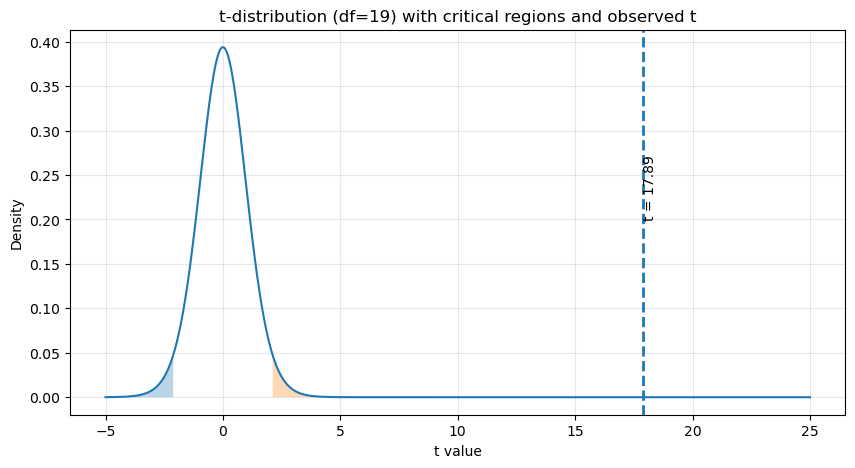
plt.figure(figsize=(10,5))
plt.plot(x, y, linewidth=1.5)
plt.fill_between(x, 0, y, where=(x <= -t_crit), alpha=0.3)
plt.fill_between(x, 0, y, where=(x >= t_crit), alpha=0.3)
plt.axvline(t_stat, linestyle='--', linewidth=2)
plt.text(t_stat, max(y)*0.6, f"t = {t_stat:.2f}", rotation=90, va='center')
plt.title(f"t-distribution (df={df}) with critical regions and observed t")
plt.xlabel("t value")
plt.ylabel("Density")
plt.grid(alpha=0.3)
plt.show()